We could have put constraint layers on the map a long time ago. We held off because the versions we looked at either needed a GIS degree to make sense of, or they slowed the map down, and a map that stalls every time you switch something on is worse than no layer at all.
We wanted them to work the way the rest of Plota does. The work happens before you arrive rather than on your machine, which is why turning a layer on costs you almost nothing and why it works on a phone as well as it works on your desktop.
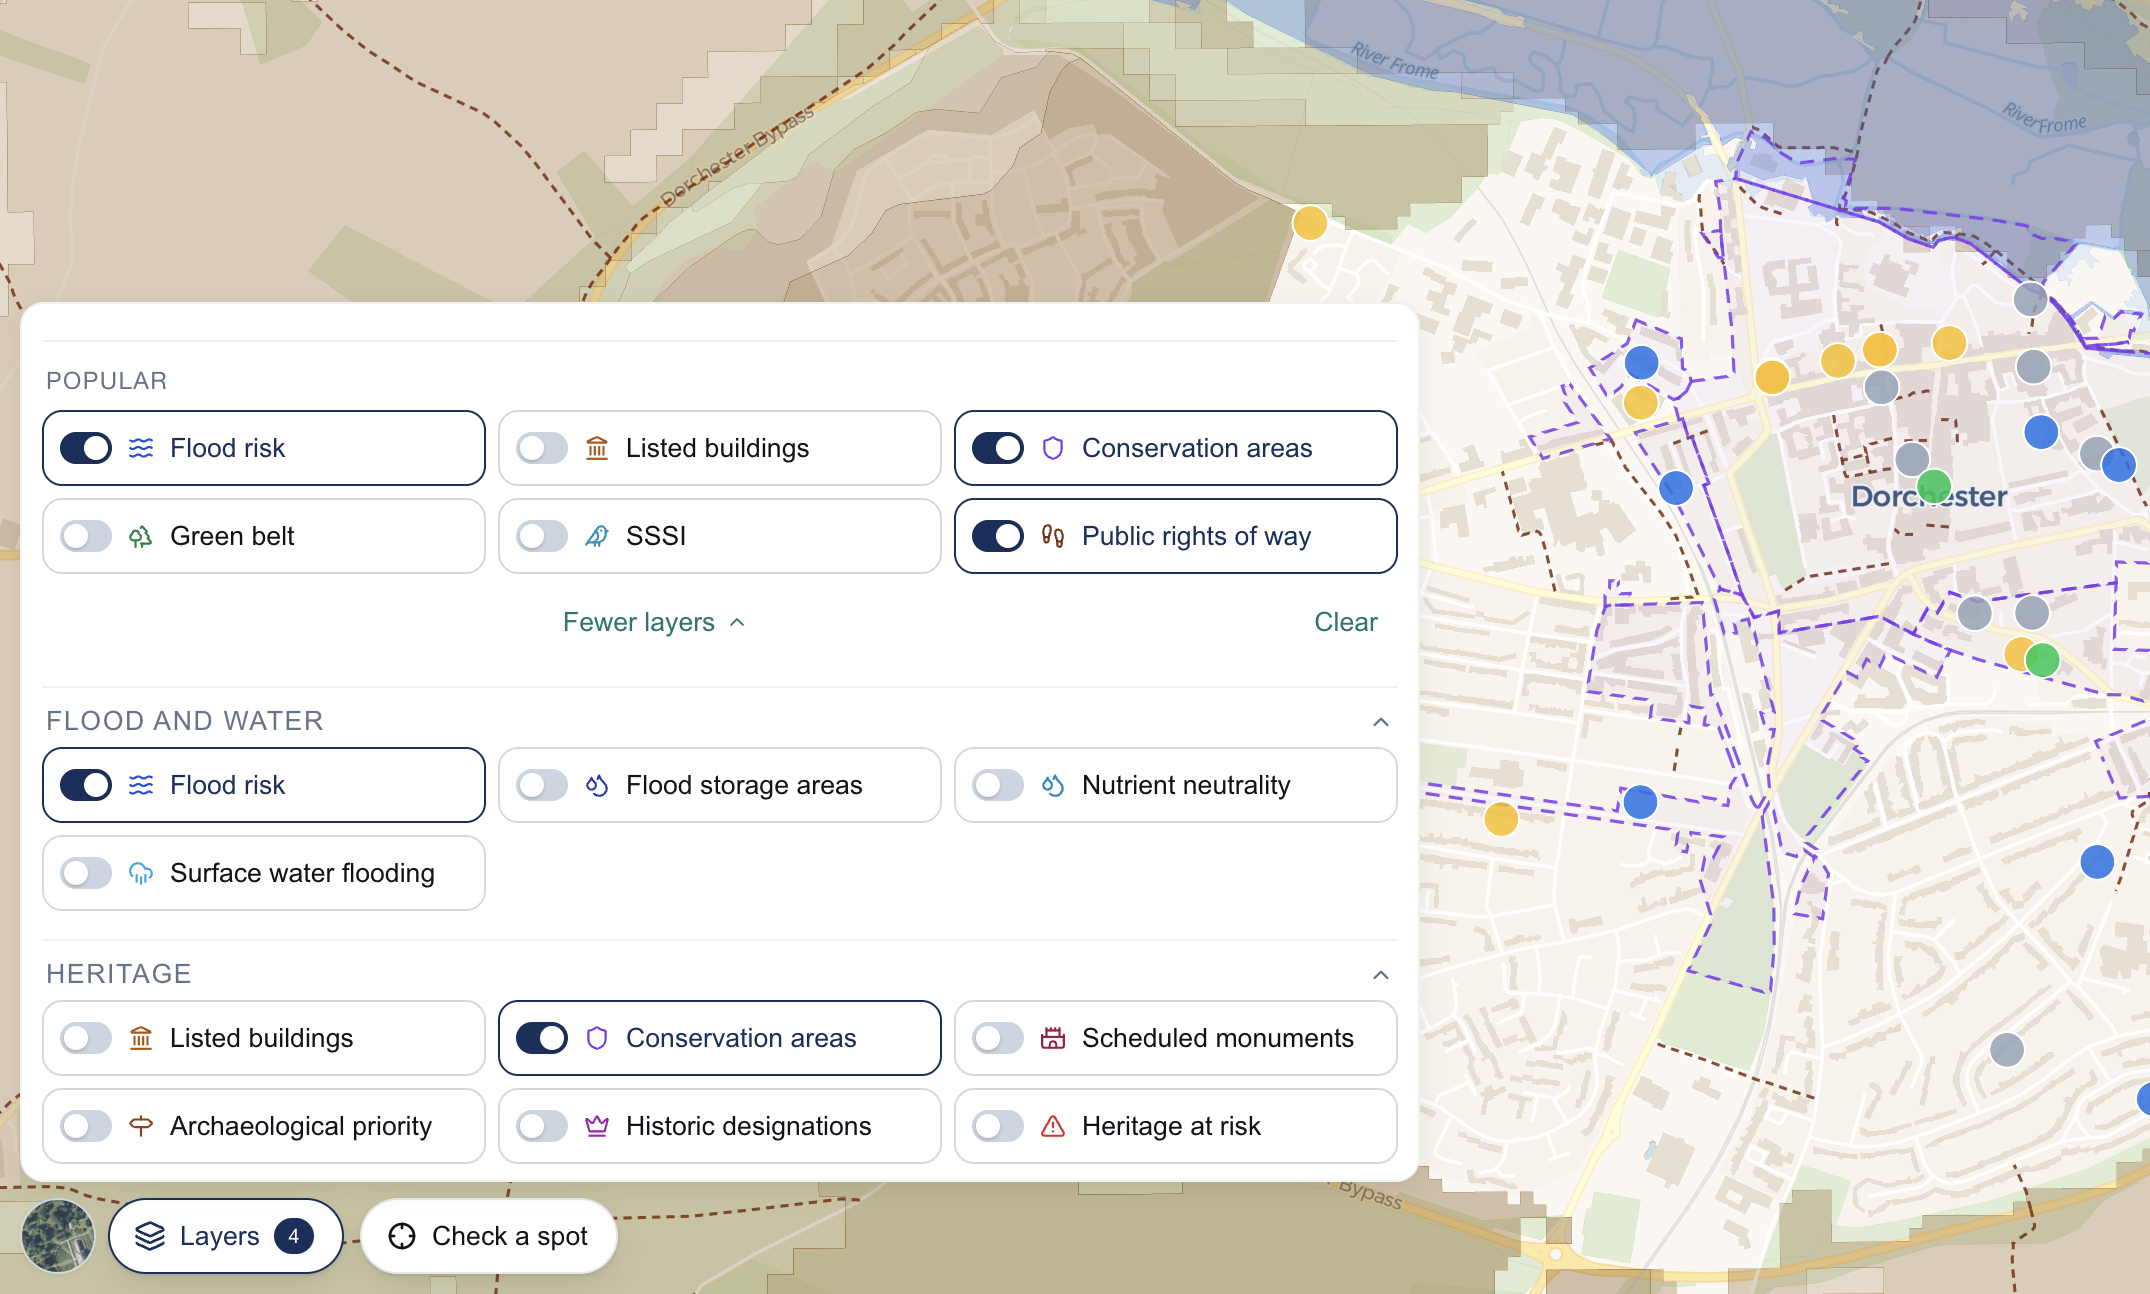
Every map on Plota now has a Layers button. Press it and you can draw flood zones, listed buildings, conservation areas and 35 other designations straight onto the map you are already looking at. Click anywhere and it names what is there and links to the record it came from.
The layers add context to the application you are looking at. A proposal reads differently once you know the building is Grade II listed, or that a public footpath crosses the site, or that it sits in flood zone 3. Green belt tells you one thing; Metropolitan Open Land tells you the same thing inside a city, which catches people out. An application to turn a yard into flats means something else again once you can see the yard is inside strategic industrial land, where London policy will resist it.
81 datasets, 39 switches
Counting datasets is easy to inflate. We collect 81 published datasets and show 39 switches, because the number of datasets is a measure of our work rather than a measure of what you should have to think about.
The gap between the two numbers is normalising:
- Flood risk is one switch. Zones 2 and 3 are separate datasets and are drawn in separate colours, so the distinction is on the map rather than behind a click.
- Protected wildlife sites is one switch over five registers: special protection areas, special areas of conservation, Ramsar wetlands, and national and local nature reserves. Click one and the card names which of the five you hit.
- Listed buildings is one switch over three countries. Historic England, Cadw and Historic Environment Scotland publish separately, with different column names and different grade wording. We map them onto one shape.
13 of the 39 switches draw on more than one country's register. A boundary between England and Wales is a change of publisher, not a change of what you can see.
Farmland grades, updated 11 September
When this was published, farmland came from the map Natural England surveyed in the 1970s and 80s. It is drawn at 1:250,000, it does not split grade 3 into 3a and 3b, and the towns it leaves blank are the towns as they stood forty years ago, so the shading ran over four decades of housing.
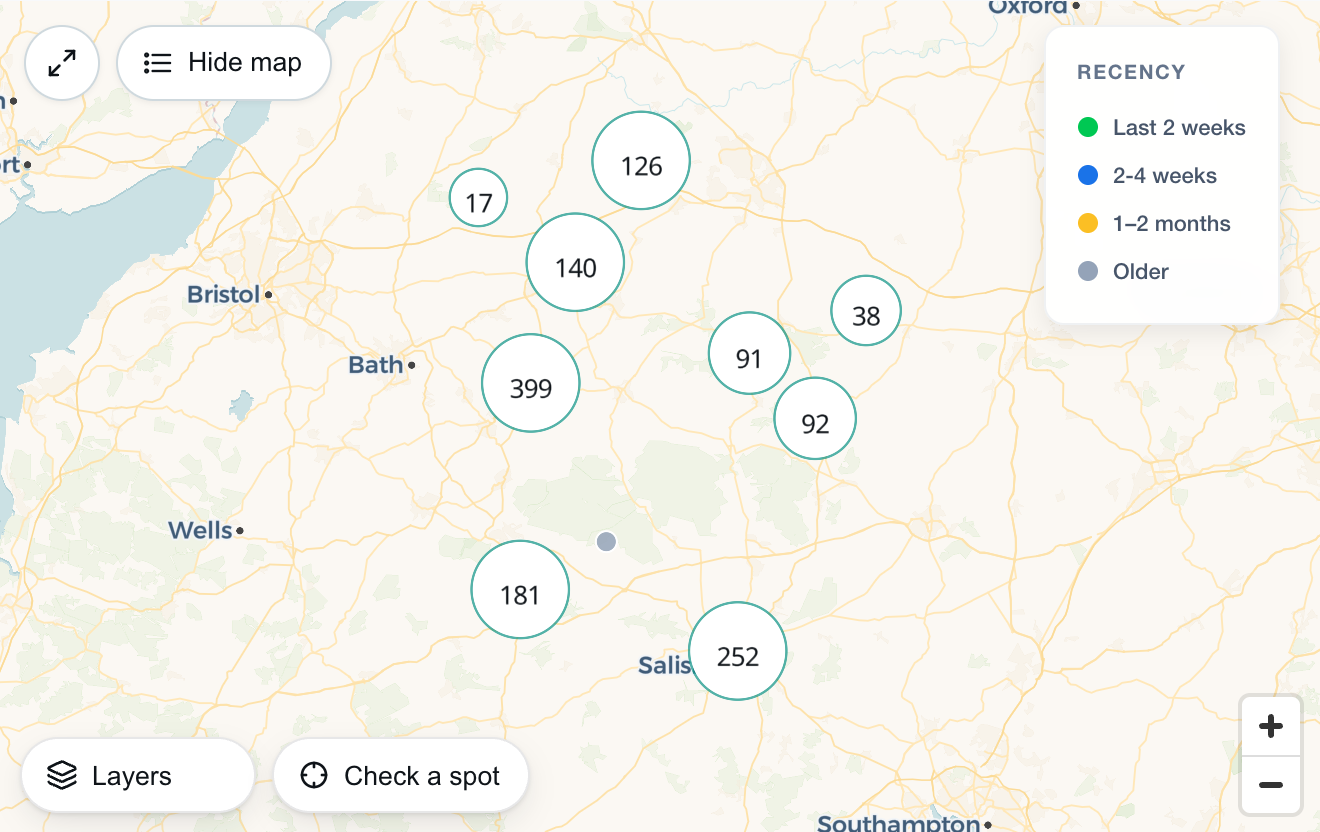
It now comes from three sources. Natural England's post-1988 field surveys are used wherever one exists: 3,576 surveys covering 231,831 hectares. That is roughly 2% of England's farmland, and a much larger share of the land people apply to build on. Everywhere else in England we use the predictive map Defra published in October 2025 and revised in March 2026, which does split 3a from 3b. Wales uses the Welsh Government's predictive map. Today's built-up areas are cut out of both.
The 1970s map stays as its own switch, because it is the one most planning maps still show. Draw both and the disagreements are visible. A field can be grade 2 on the old map and 3b on the new one, and neither of them is a site survey.
Quick enough to leave switched on
Turn a layer on and it draws straight away. Turn all 39 on and the map still pans. You can work with them on rather than switching them off to get the map back, and whatever you leave on follows you to the next map.
It works on a phone
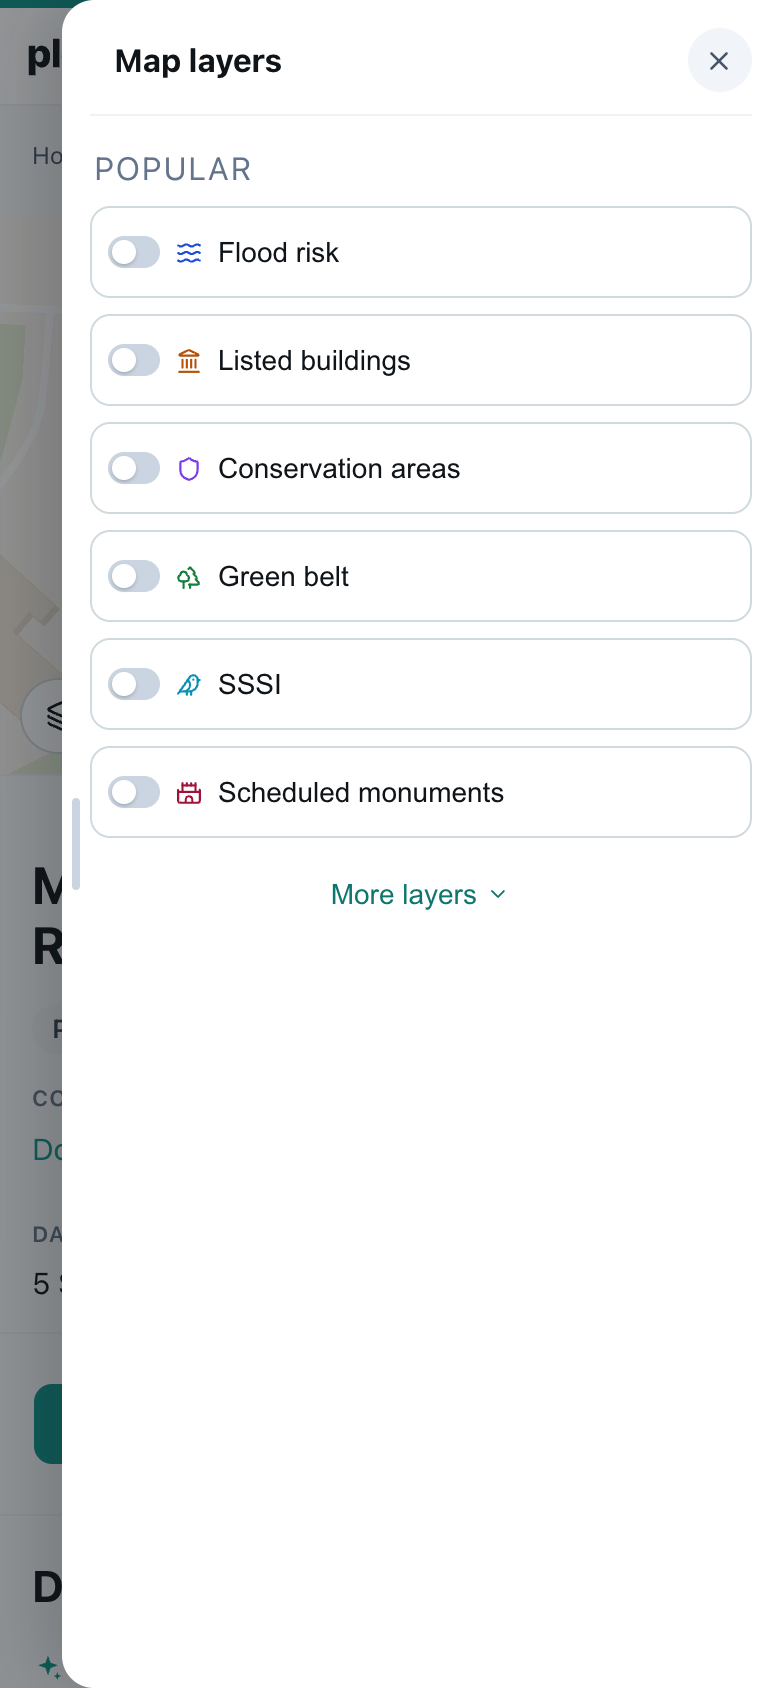
Every switch works on a phone, in a drawer that opens from the right, so you can stand in front of a building and check whether it is listed and what grade it is. Constraint mapping is normally something you do back at a desk.
One click, one card
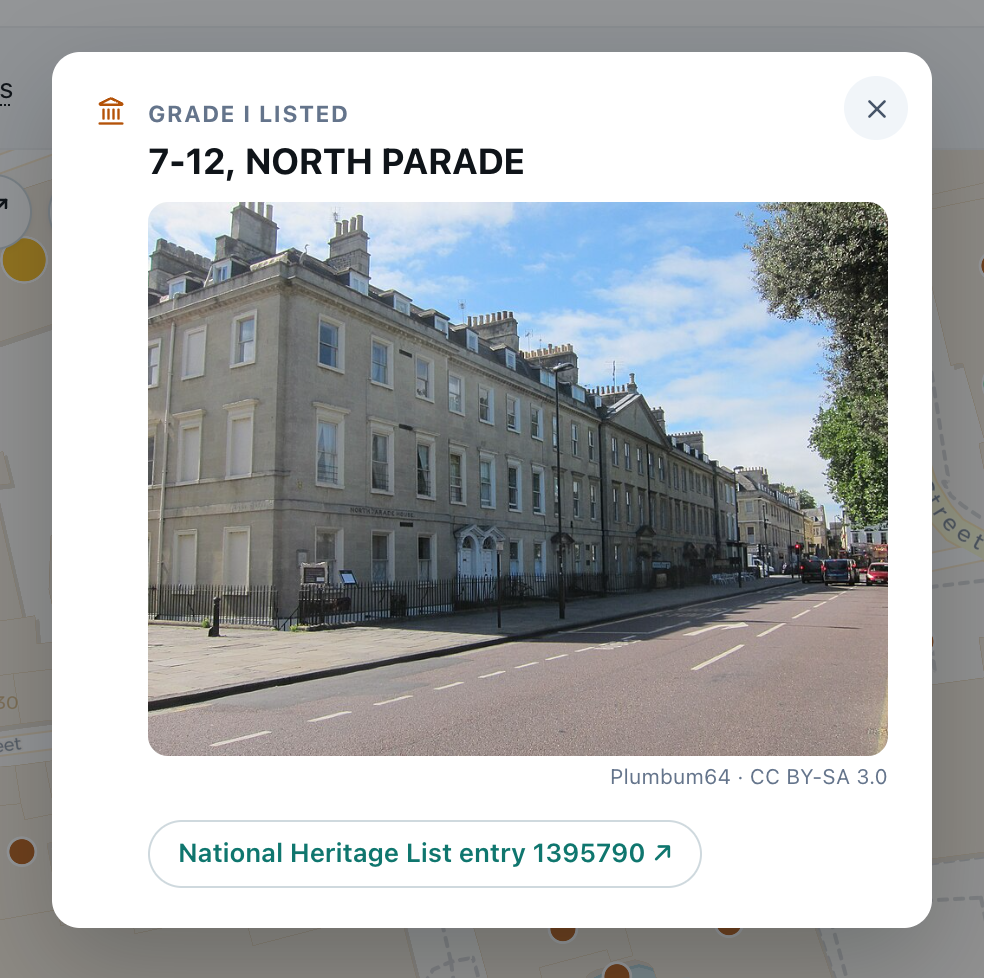
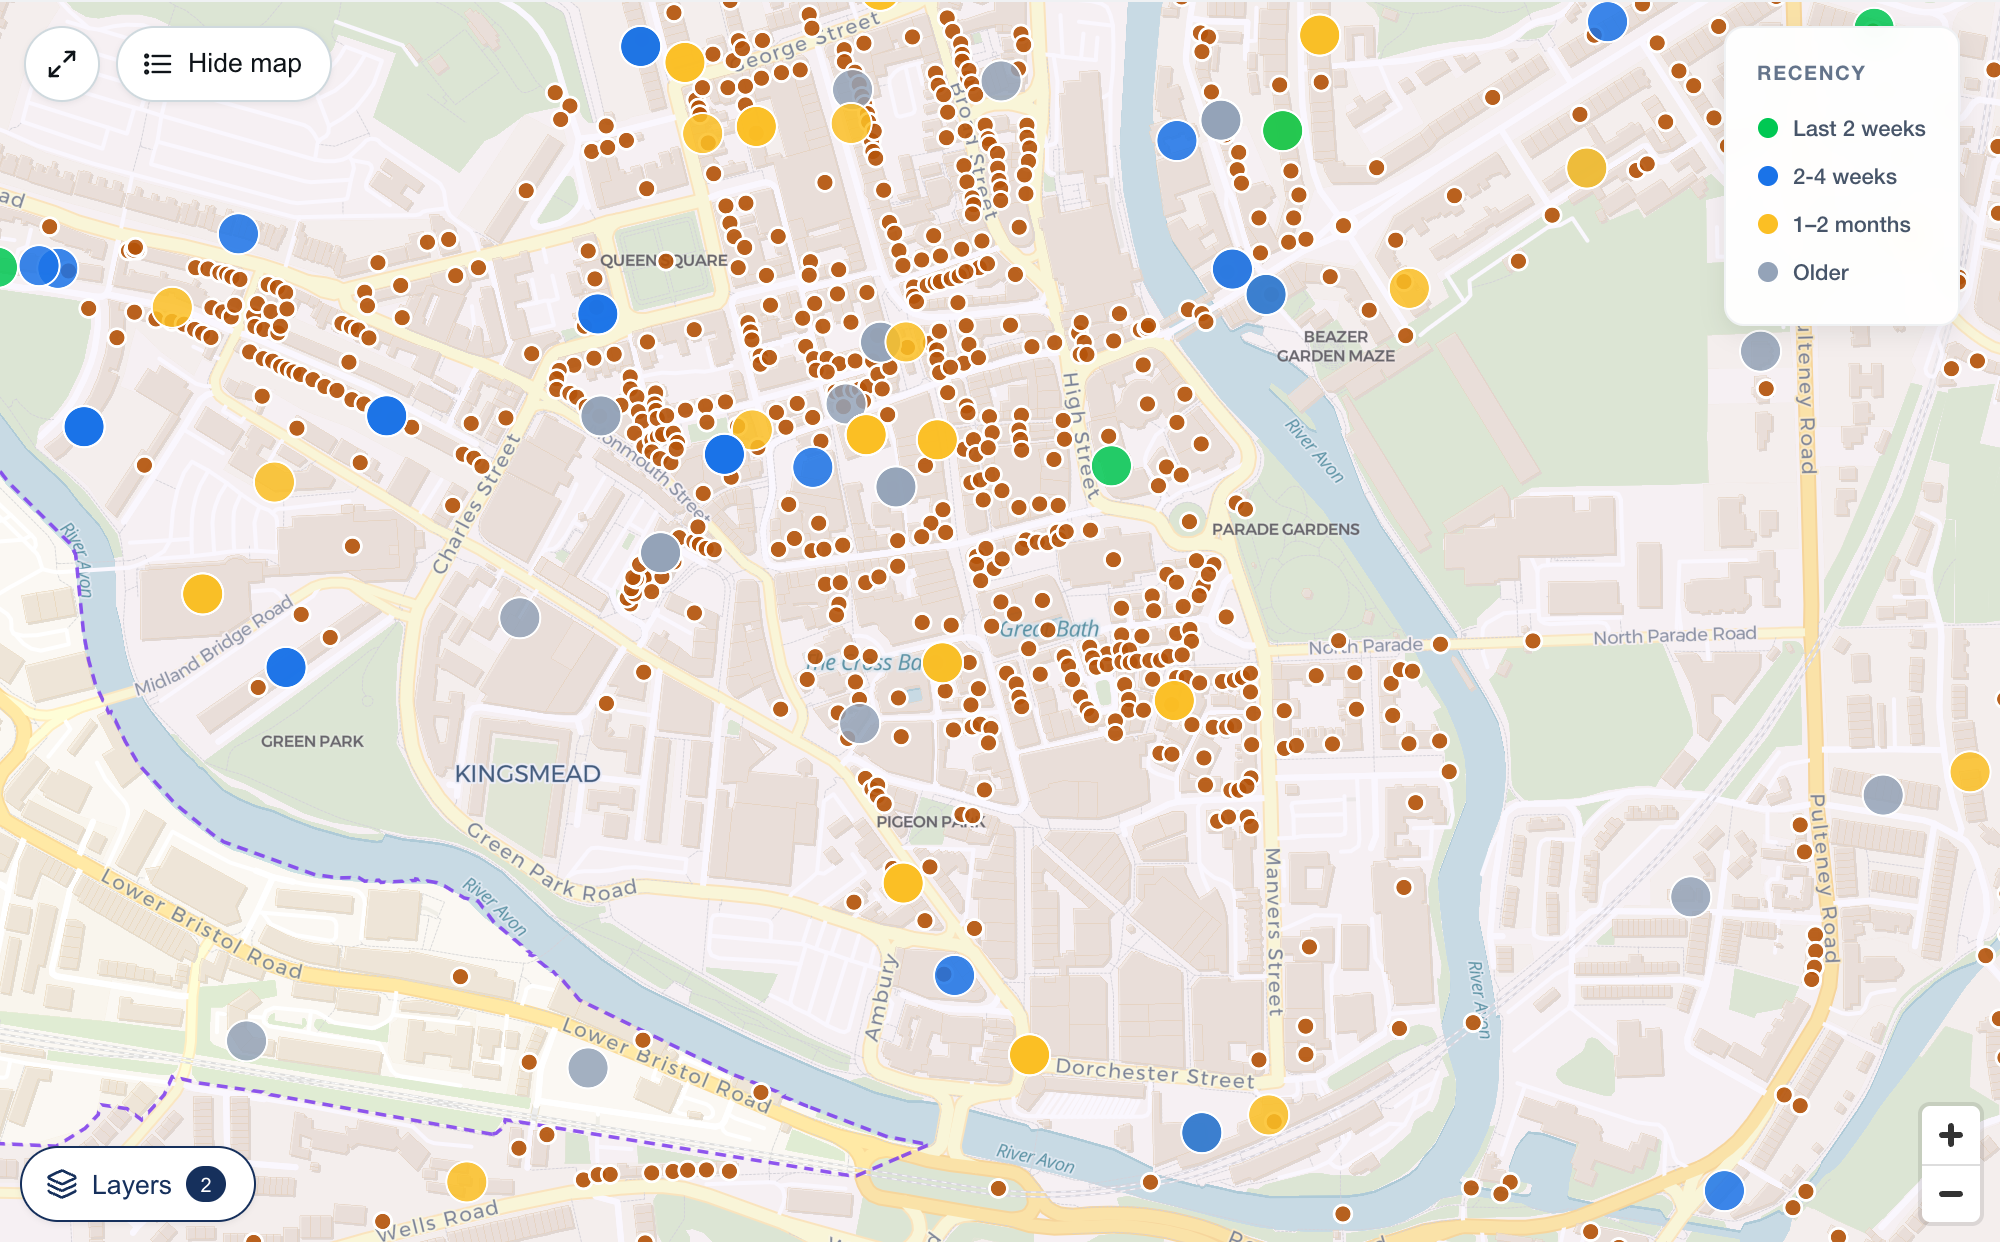
One click gathers everything under that point into a single card: the designation, its grade or catchment, and a link to the source record. Where a photograph of a listed building is available from a third party source, the card shows it, which saves checking you have the right building.
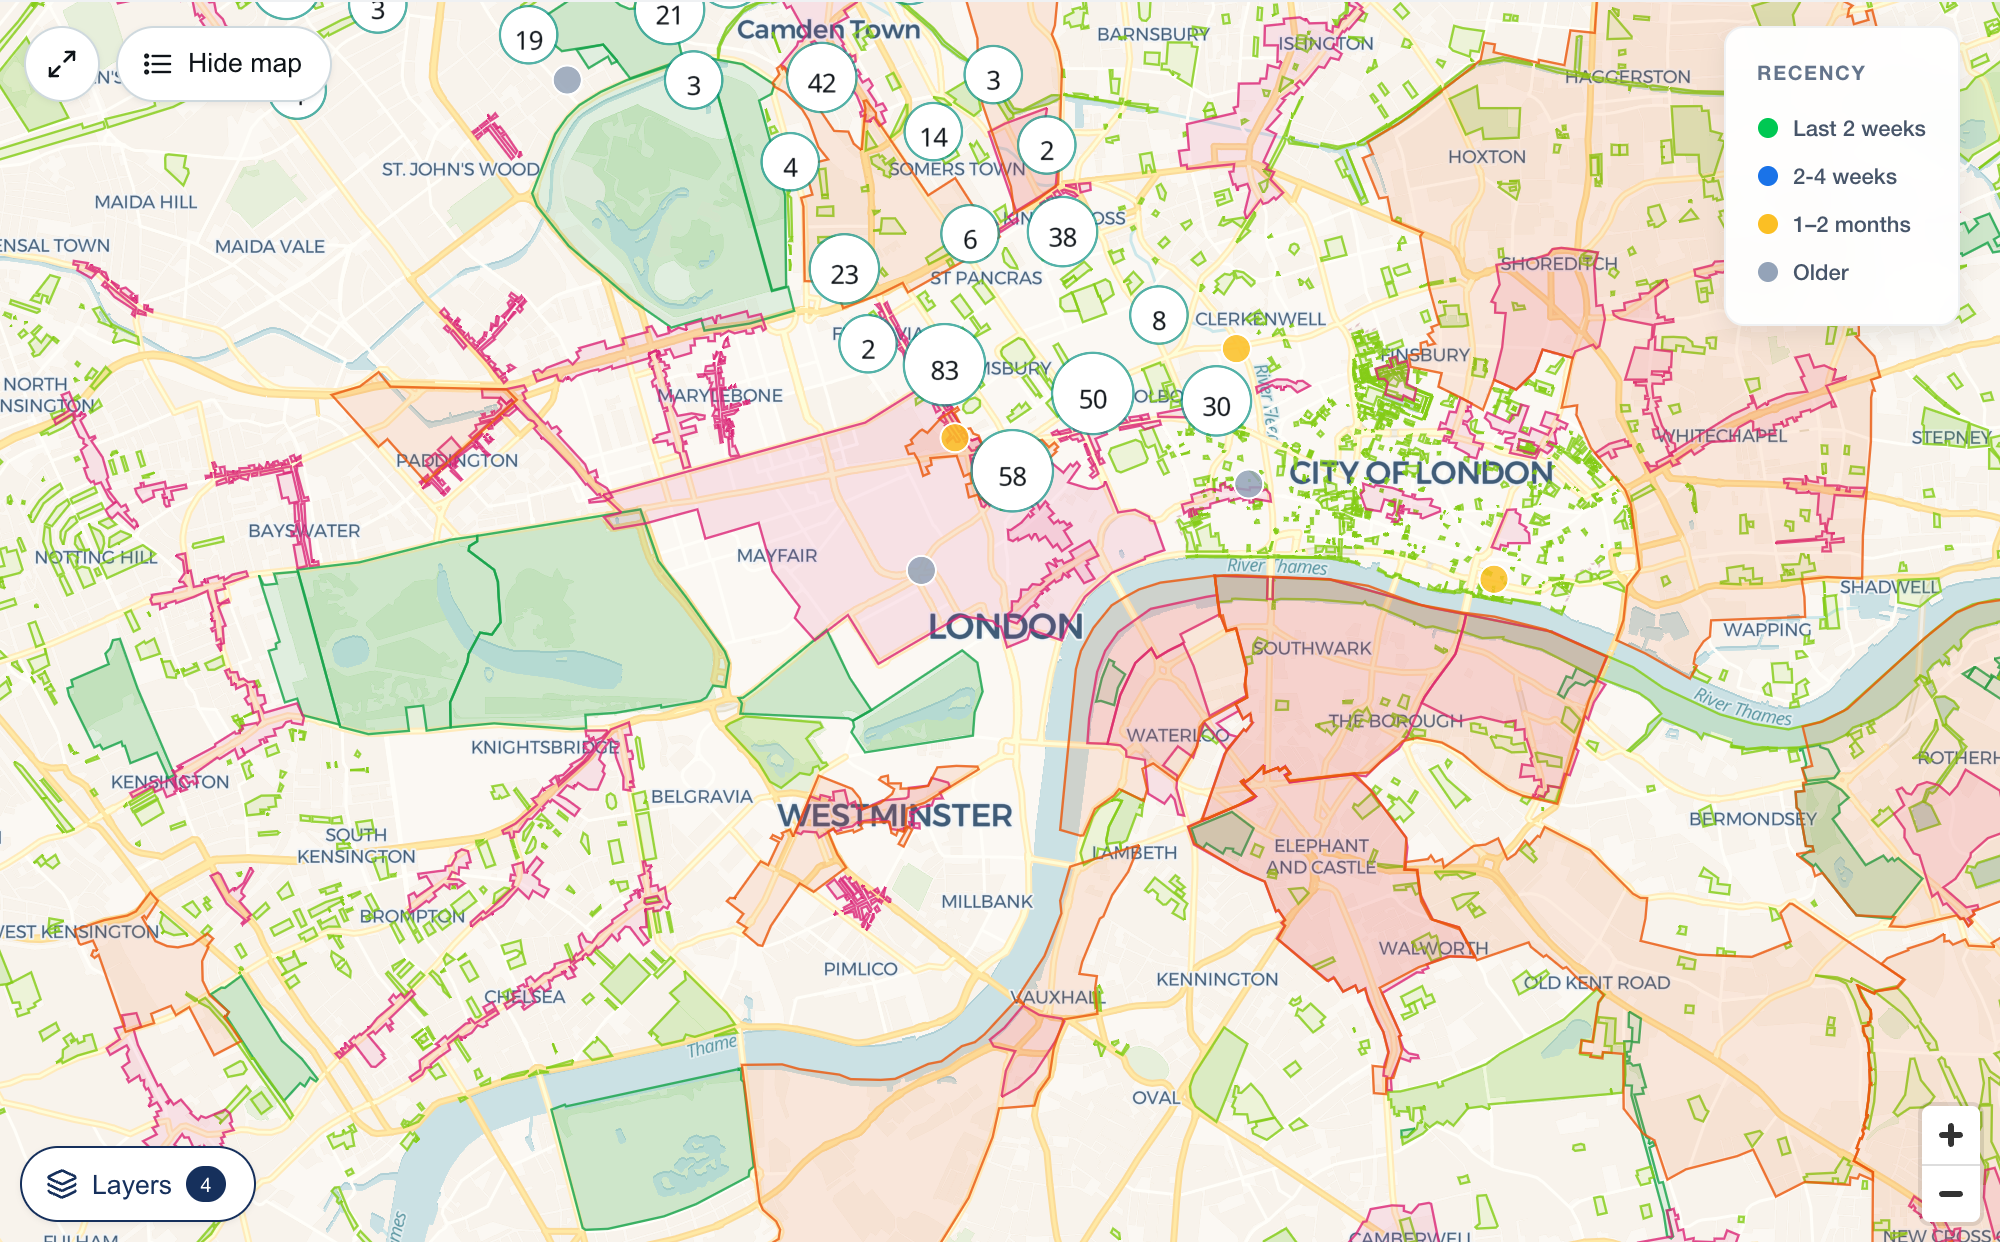
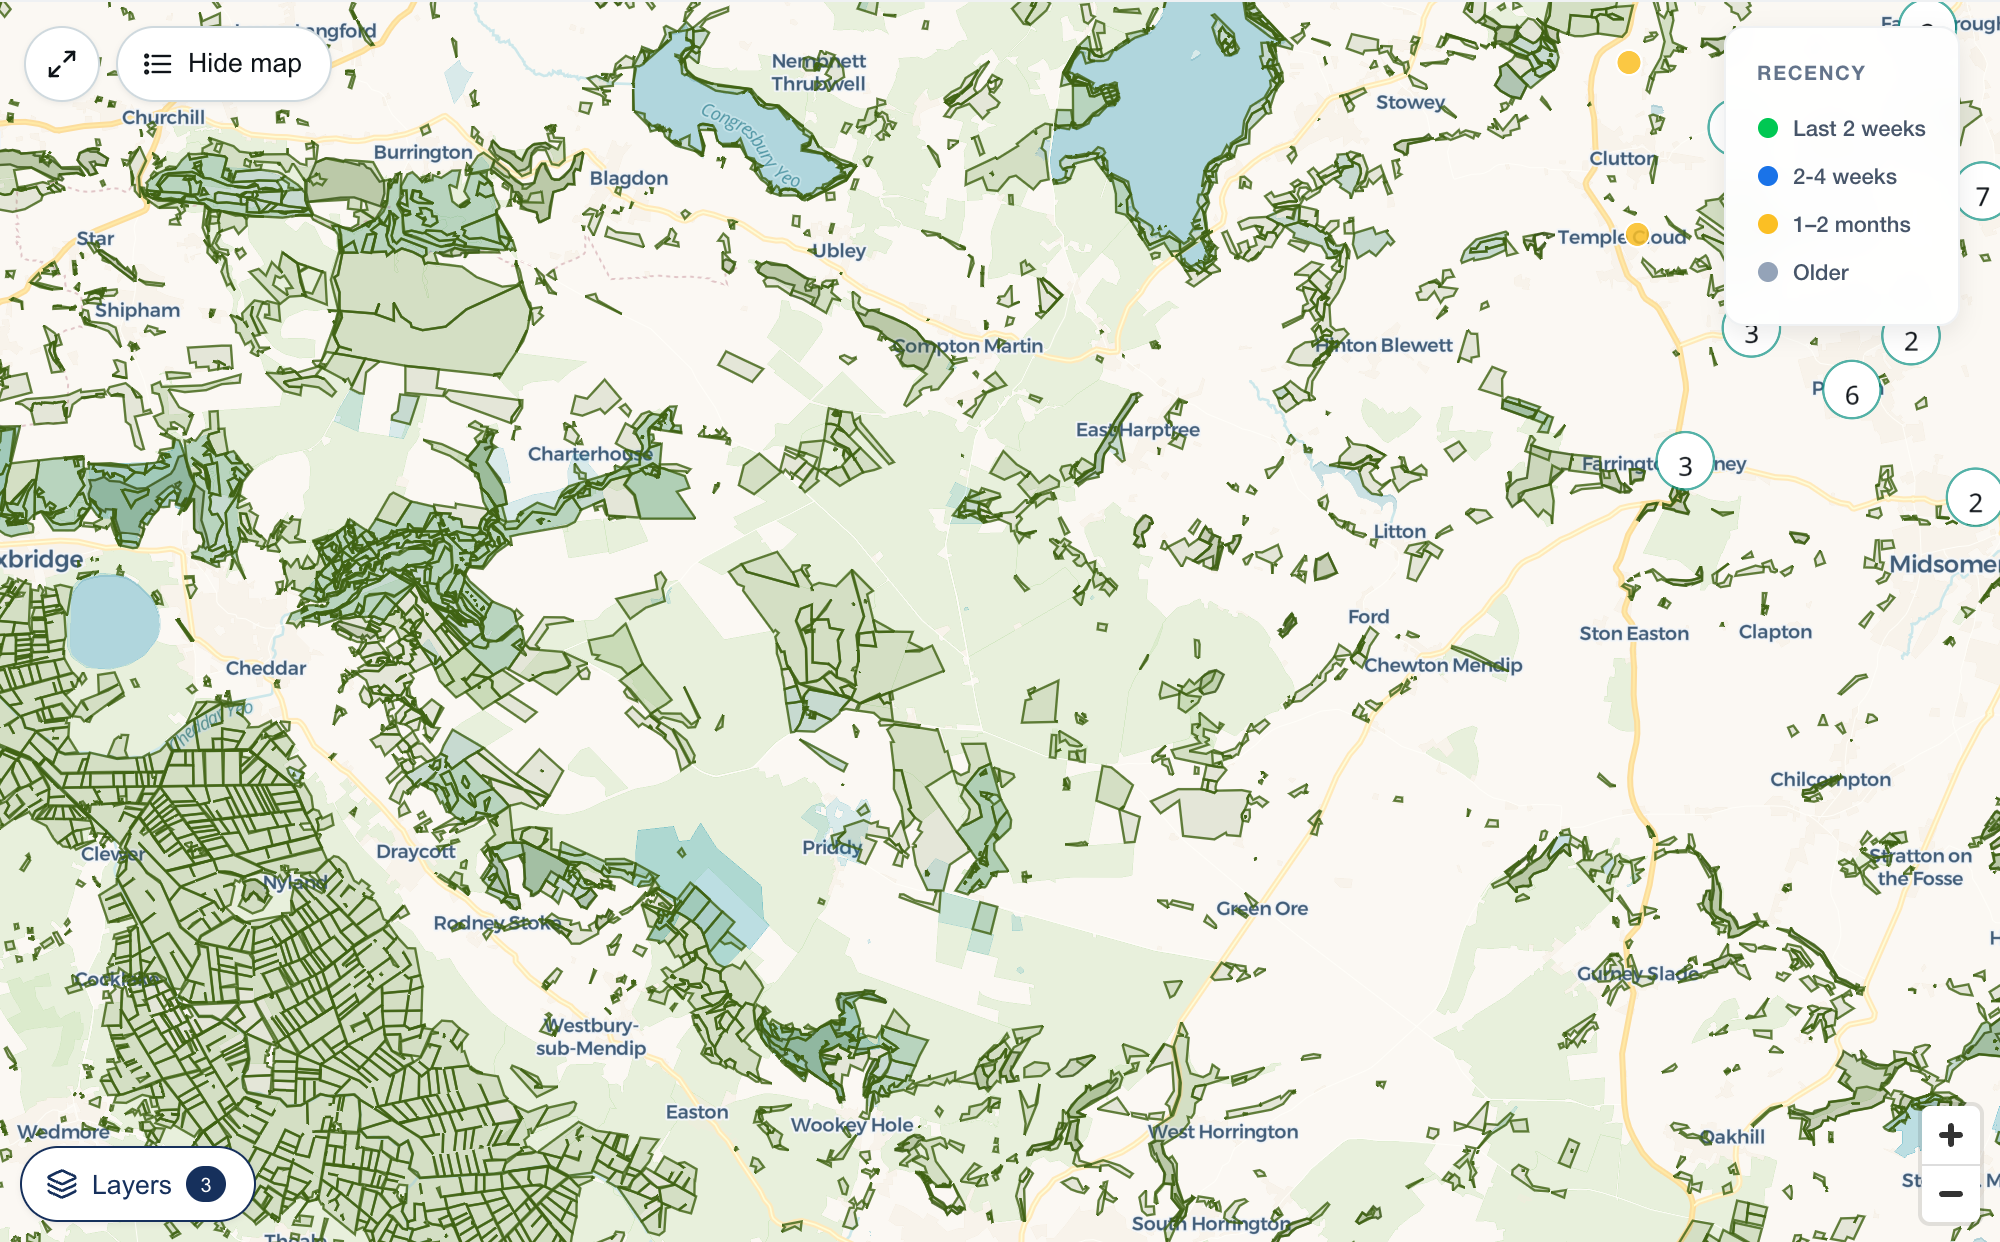
All 39
The full list
The six that open by default
- Flood risk. Rivers and sea, zones 2 and 3. England and Wales.
- Listed buildings. England, Wales and Scotland.
- Conservation areas. Where councils have published them.
- Green belt. England only: Wales uses green wedges in local plans.
- SSSI. Sites of special scientific interest.
- Scheduled monuments. National Heritage List for England.
Flood and water
- Flood storage areas. Land engineered to hold flood water.
- Nutrient neutrality. Catchments where new homes must offset nutrients.
- Surface water flooding. England and Wales. Zoom in to a street to see it.
Heritage
- Archaeological priority. Areas where archaeology is a planning consideration.
- Historic designations. Registered parks and gardens, world heritage sites, battlefields and protected wrecks.
- Heritage at risk. Historic England register of places assessed as at risk.
Nature
- National parks. England.
- National landscapes. Areas of outstanding natural beauty.
- Ancient woodland. Natural England inventory.
- Protected wildlife sites. Special protection areas, special areas of conservation, Ramsar wetlands and nature reserves.
- SSSI impact risk zones. Where development may need Natural England consulted. The link is per zone.
- Priority habitats. Heath, bog, meadow, grassland and woodland of principal importance.
- Habitat networks. Where habitat is joined up enough to work as a network.
- Nature recovery projects. Named landscape-scale nature recovery projects.
- Heritage coast. Defined stretches of undeveloped coastline.
- Nature improvement. Nature improvement areas: landscape-scale areas targeted for nature.
Access and paths
- Public rights of way. Footpaths, bridleways and byways. Not the legal definitive map.
- Open access land. Where you may roam under the CRoW Act, mostly upland.
- National trails. Named long distance routes and the coast path margin.
Land and policy
- Tree preservation. Where councils have published them.
- Article 4 areas. Where councils have published them.
- Air quality. Air quality management areas declared by councils.
- Brownfield land. On a council brownfield register.
- Built up areas. The edge of where the country is already built on.
- Central activities zone. The core of central London in the London Plan.
- Agricultural land. Grades 1 to 5, with 3 split into 3a and 3b. Surveyed where a survey exists, predicted from the soil map elsewhere.
- Provisional farmland map. The 1970s map most planning maps still show, kept for comparison.
London
- Metropolitan Open Land. London only. Open land with green belt level protection.
- Designated open space. London only. Parks, commons and other protected open space.
- Strategic industrial land. London only. Reserved for industry and logistics.
- Locally significant industrial. London only. Borough level industrial sites.
- Opportunity areas. London only. Where the plan expects significant growth.
- Town centres. London only. Boundaries from the London Plan.